So, into week three of home schooling and I am close to expelling three pupils and taking early retirement!
At the end of last year the market cap of Zoom was a quarter of that of the big US airlines (Delta, United, American & Jet Blue) and now it is the same size as the four combined at $44.1bn. Though grateful for its properties now I suspect that many, myself included, will be happy to meet face to face again!
In our upside-down world there are many new things to wrestle with and whether you believe in a ‘V’ or ‘tick’ shaped recovery the small business fallout will be very difficult to address. There are 30m small US businesses and SMEs account for 83% of US employment.
In a letter to US Congress, the National Restaurant Association estimated a $225bn decline in US restaurant revenue over the next 3 months and a loss of 5-7m jobs.
When one looks at the economics of stoppage it is worth looking at data from the Department of Labor, Transportation and Commerce in the US. More than 4.7bn global airline passengers were expected to fly this year and there are 10.6m people employed in the US aviation industry. Consider the 1.1bn US hotel guest nights and the 129.4m live spectators at US professional sports events, all of which will go to zero during lockdown.
The reverse multiplier impact will be vast. Deutsche Bank is forecasting a Q2 decline in US GDP of 12.9%, which is 50% greater than the contraction of 8.4% in Q4 2008, but these numbers are changing on a daily basis and banks’ economists keep leapfrogging each other marking their growth forecasts ever lower. An explosion in spending post this crisis is a fallacy.
The table below is just published by BAML and shows daily spending numbers on major categories yr/yr:
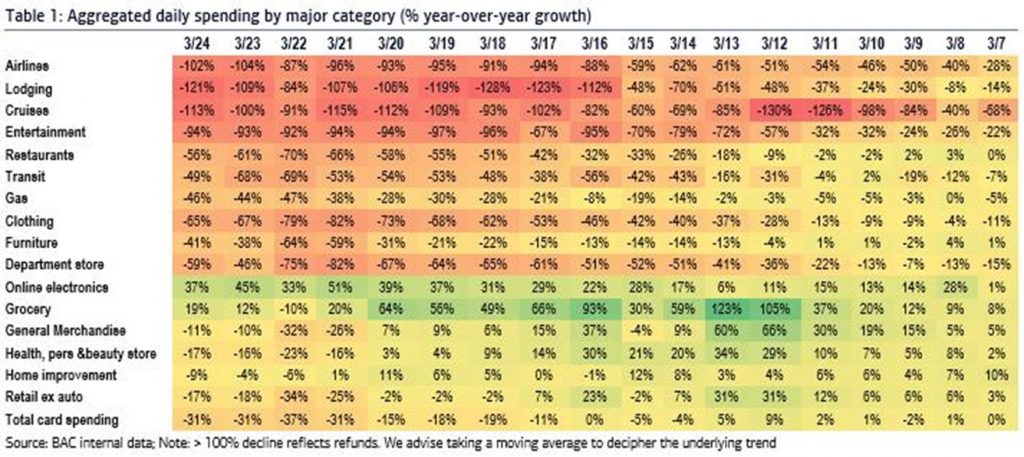
Defaults are rising quickly to double digit levels. I had a call with the CEO of an international finance company, he said it was utter chaos and they were running a policy of ‘extend and pretend’ to mitigate collapse.
The destruction of economic surplus
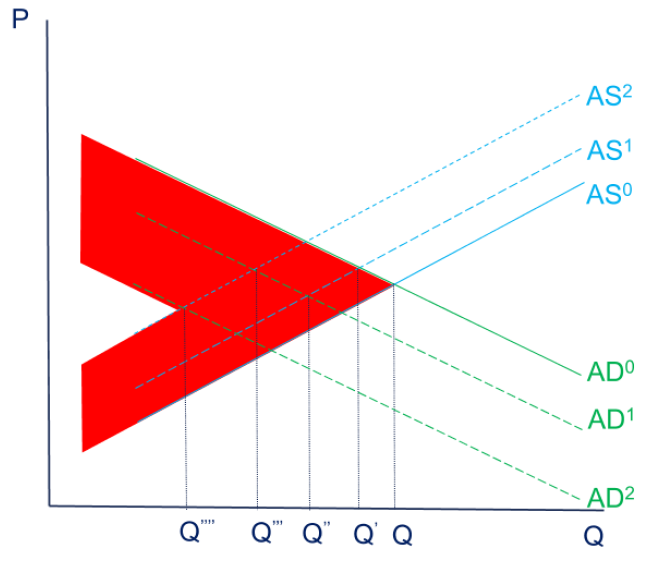
Following is how a contraction in supply leads to a contraction in demand leading to a contraction in supply leading to the destruction of economic surplus. As the LBS put it, it is a race between supply and demand.
Covid-19 causes disruption in the global supply chain coupled with self-isolation and social distancing decreasing the world’s labour supply all creating a supply side shock from AS0 to AS1. Then the demand effect kicks in as there is uncertainty about Covid-19 and its progression. People on zero hours/non-permanent workers lose income in industries such as leisure, tourism, hospitality and manufacturing. People begin to save and defer purchases of price elastic products and services as well as households increasing precautionary savings. Concerns over liquidity fears see firms hold back from spending. AD0 moves to AD1.
Falling demand feedback loops into supply. Firms with high operational leverage and low margins lack liquidity to fulfil commitments. There is an increased risk of a bankruptcies. AS1 moves to AS2. Employees made redundant from closing businesses lose their income reducing consumption further. Demand falls to AD2.
Hedge Funds
Elevated market stress has driven significant dislocation in the merger arbitrage opportunity set. The increase in potential returns from a deal closing has been comparable to that seen during the late 2008 financial crisis period. From 21st February spreads have moved up to 19% wider in a three-week period. Forced unwinding primarily by quantitative funds, platforms and other hedge funds has led to largely indiscriminate selling of positions. Not all deal risk is equal, and this presents an opportunity. Characteristics of merger arbitrage returns are favourable in this environment. Spreads exhibit a strong ‘pull-to-par’ effect as deals continue to close and generate returns unlinked to market direction.
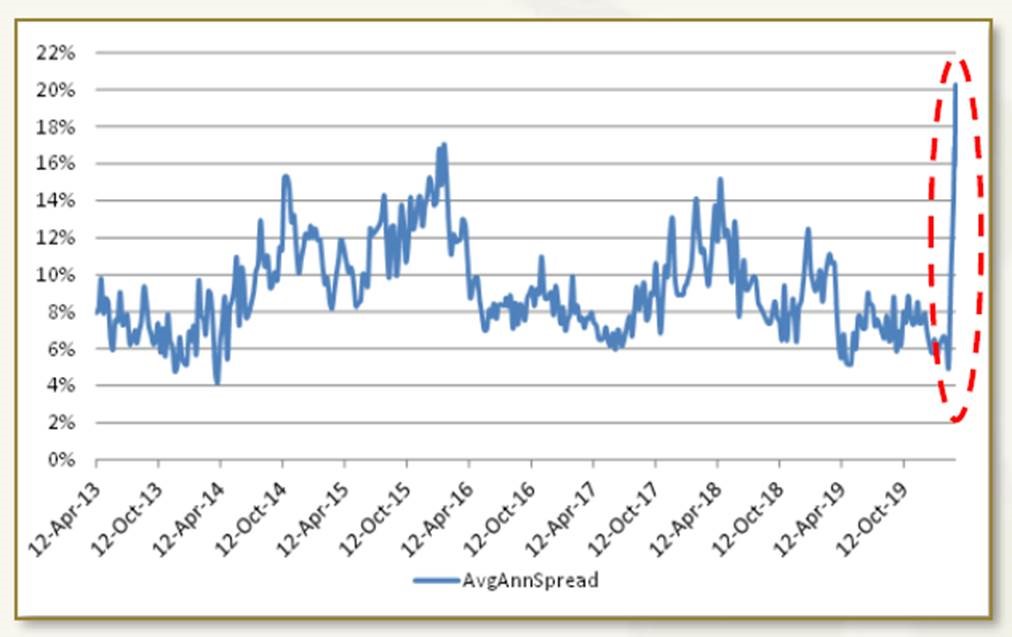
Focusing on deal specific considerations, merger arbitrage presents an opportunity to invest through taking a view on buyer intent, strategic logic and on the basis of legal contracts, as opposed to taking any broad-based view of the market environment. One leading European event fund sent me a piece last week showing 60 applicable deals currently offering an average 14% gross return with 114% annualised return. Call for further information.
This week HFM polled 260 investors across 28 countries with assets >$2.5tn on their reactions to the crisis. With 46% of global investors that use hedge funds saying they are satisfied with their performance it looks like the asset class is delivering diversification when it matters.
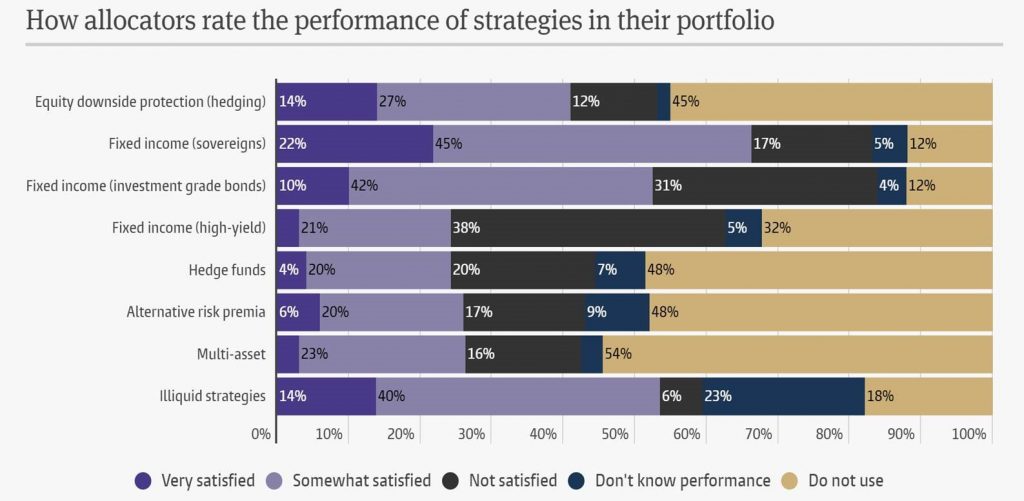
The best managed funds will likely see strong inflows this year. HFM survey respondents mentioned how pleased they were with funds that had captured crisis alpha in February and March.
Economics of Uranium
The collapse in economic activity has hit the price of most metals and minerals with the exception of uranium. The price of U3O8 has risen 15% in the last two weeks and broken out of its one-year trading range.
At our first Ocean Wall breakfast back in November 2019 we had Andre Liebenberg CEO of Yellow Cake Plc present. Uranium, the most common fuel type being used in nuclear power plants has been in a near-constant bear market since the global financial crisis in 2007-8. As you can see below, the uranium price had a valiant attempt at recovering in 2010-11, but the disaster at the Fukushima in March 2011 caused large parts of the world to turn decisively against nuclear power, and the uranium price has been weak ever since. Things, though, are beginning to turn.
The recent catalyst is that Covid-19 is causing mines to close albeit temporarily. Demand for uranium is highly distributed. There are 442 reactors around the world. Supply though is concentrated with six mines in Kazakhstan, Canada and Namibia producing 2/3rds of global supply. Last week Cameco announced the closure, for a month, of Cigar Lake which produces 13% of supply. Two days later Namibia halted all activity. Kazatomprom, the state controlled Kazakh miner, has yet to close any mines.
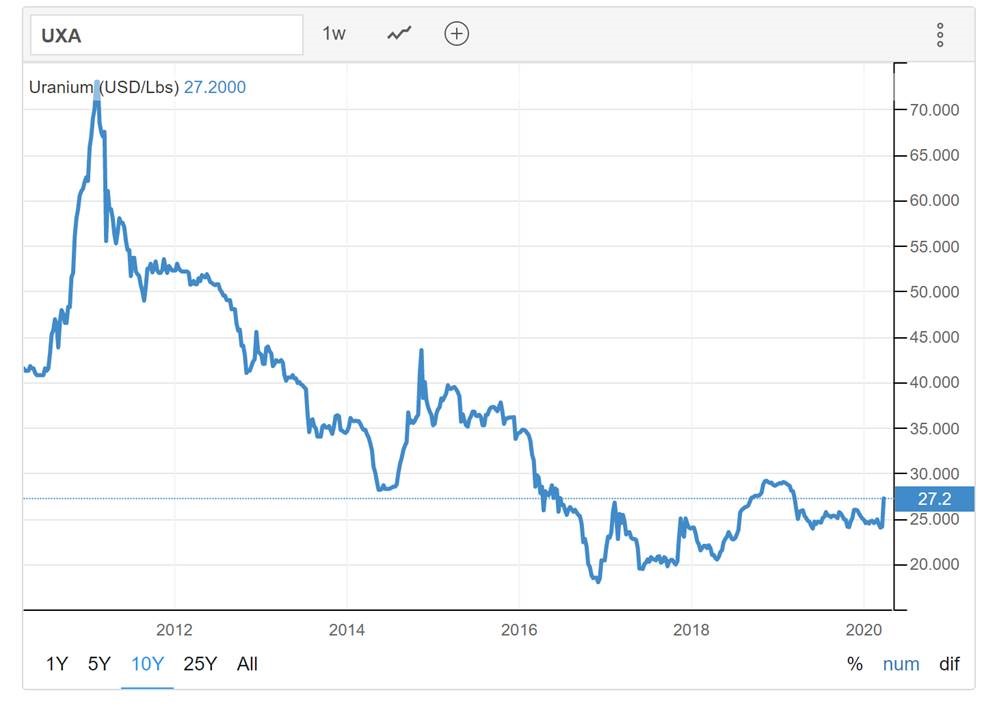
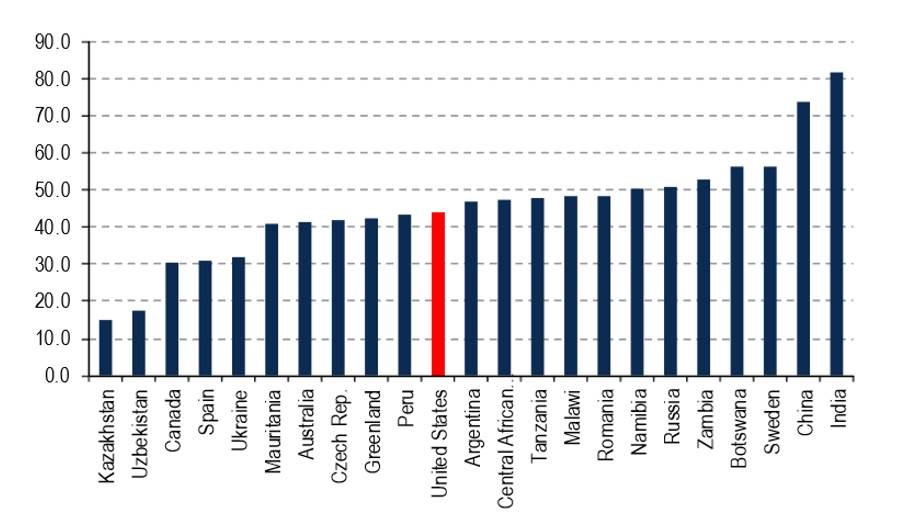
With the uranium price at around $27/lb, most uranium producers are immensely unprofitable. Below is the production cost per $lb. As a result, supply has been cut over the last couple of years.
Demand for uranium is price inelastic. Once up and running, a nuclear power plant becomes a captive buyer, almost irrespective of price as there is no substitute to uranium for existing uranium-fuelled power plants. Should the uranium price double (say from $25/lb to $50/lb, the fuel cost in a tier one US nuclear power plant will jump from 1.3 cents per kWh to 1.42 cents per kWh – an increase of less than 10%. In other words, even a massive jump in the uranium price should only have a modest impact on electricity prices.
The last time there was a supply shock was in 2006 when Cigar Lake was flooded. The price of U3O8 went from $20/lb to $165/lb in a year. Back in 2006 there were 450 listed equity uranium plays valued at $130bn. Today there are less than 40 with a total sum of market caps now under $8bn.
There are several funds focussed on this play, call for details.
Shipping
In January this year we hosted our breakfast on shipping and had Flurin Grond from Progressive Capital (PCP) in Zug and Dave Morant CEO of Scorpio Tankers,UK. While 2020 could become one of the worst years for the world economy in a long time; it could be one of the best years for tanker company profits. At the same time as most businesses fear the devastating consequences of an unprecedented global demand shock, tanker operators await mind-blowing cashflows. After March 6th oil and tanker investors focused mostly on the OPEC+ production surplus strategy, but during the last two weeks the focus has shifted to the expected global energy demand collapse, which sent the oil market into a “super-contango” of, currently, $17 for 1-year.
As country after country has been put into lockdown, projected demand reductions now vary between 15-35 million barrels per day (mbd) during the expected peak stress periods in Q2 2020; this in a market that normally balances supply and demand at roughly 100 mbd. PCP have modelled the oversupply for 2020 thus:
- Q1 2020: +6 mbd
- Q2 2020: +13 mbd
- Q3 2020: +3 mbd
- Q4 2020: -3 mbd (undersupply)
Obviously, oil demand over the next 12 months has many unpredictable variables, and the estimate needs constant reassessment as both the oil price war and the COVID-19 situation can change rapidly. Still, with such over-supply, global oil inventories are surging at an unprecedented pace, and we see stock building of around 1,600 million barrels (mb) (+/- 300 mb) by the end of June.
The question to ask is: “where will the excess supply go?” And the answer is: “Partially this will go into onshore storage facilities (including strategic petroleum reserves (SPR)), and the rest will be stored on tankers.” The total available land storage capacity is 7,500 mb of which we estimate 75% is filled-up currently. Land storage and SPR are never filled up to 100%. Assuming they will be filled to a high level of 90% capacity, that means there is roughly 1,125 mb capacity available.
The continued collapse in oil demand is pushing oil prices sharply downwards and into a “super-contango”. While today (30.3.20) spot Brent Crude trades at $22, the 1-year forward contract trades at $ 39; a difference of $17.
This large contango offers an opportunity for physical arbitrage: a trader can buy 2mb Brent Crude (the capacity of a VLCC) at $22 a barrel, store it on a VLCC for 1 year, and sells the crude forward 1 year at $39; which results in a gross profit of $34m. As long as the costs for tanker charter, financing and arrangement fees are smaller than $34m; the trader makes a risk-free profit. Based on these metrics, there is a VLCC day-rate floor of around $75,000 per day (time charters typically trade at a discount to sport rates). Currently, the contango supports $100-120,000 per day on a 6-months basis and 75,000 on a 12-months basis.
Floating storage is now booked at an exceptional pace, and shipbrokers estimate that as many as 150 VLCCs could leave the market for 6-12 months. To put this into context, the entire global VLCC fleet is currently 815 vessels. The contango further out on the curve may increase as well and support 12-24-months physical arbitrage and thereby increase time charters in that time range.
So, tanker owners are the main beneficiaries. It looks like Q2 2020 will be one of the most profitable quarters in history for large crude carriers. The VLCC spot rates rallied past $200,000 per day last Friday (27.03.20). This is the second time in two weeks.
We expect dramatic cash flow generation for tanker companies over the coming six to nine months, and this will result in a rapid NAV build, even without any real asset value appreciation.
PCP feel this is not priced into tanker company equities. The market realised around the 24th March that these outsized cash flows are about to come, and prices of tanker equities have jumped 20-30% over the last five days. Still, there are a lot of tanker companies that trade at a discount to NAV and expected P/E ratios of around 3x 2020 earnings. What if OPEC+ gives in and cuts back on production? Ultimately OPEC+ will give up and reduce output and that may happen in Q3, though PCP feel the risk of this development has been reduced over the past weeks as the demand shock by the global lockdown is the main driver in the 1,600 mb (+/- 300 mb) oil stock building by the end of June.
By the 4th quarter of 2020 oil demand should recover and the market will find a new equilibrium. At that point, the 1,600 mb (+/- 300mb) oil stock will gradually be worked back into the market, but this could take 1-2 years. The market view is still different as it fears that after the Q2 and Q3 cash flow party, there will be a hangover which will start in Q4 2020. With global oil demand down 15–20mbd (expected for Q2 2020) the underlying situation is very difficult for producers. At some point they will cut production or, eventually, the complete lack of oil infrastructure investments will force output down. With lower demand, storage will be unwound, and more tanker capacity will become available.
PCP think there is a significant difference to the 2008/9 period when the market was last in such a super contango. The main one being that the order books for tankers today stand at a very low level of 7% of the fleet versus a level of 50% back then. Moreover, many of the 15 years and older tankers that now go into the floating storage market are unlikely to come back once their storage contracts are over and the charter rates are lower again. I can put you in touch with Flurin if you would like to discuss this further.